
Possible breach of support level by Hong Kong 50 Index
Hong Kong 50 Index is moving towards a support line which it has tested numerous times in the past. We have seen it retrace from this line before, so at this stage it isn’t clear whether it will breach this line or rebound as it did before. If Hong Kong 50 Index continues in its […]
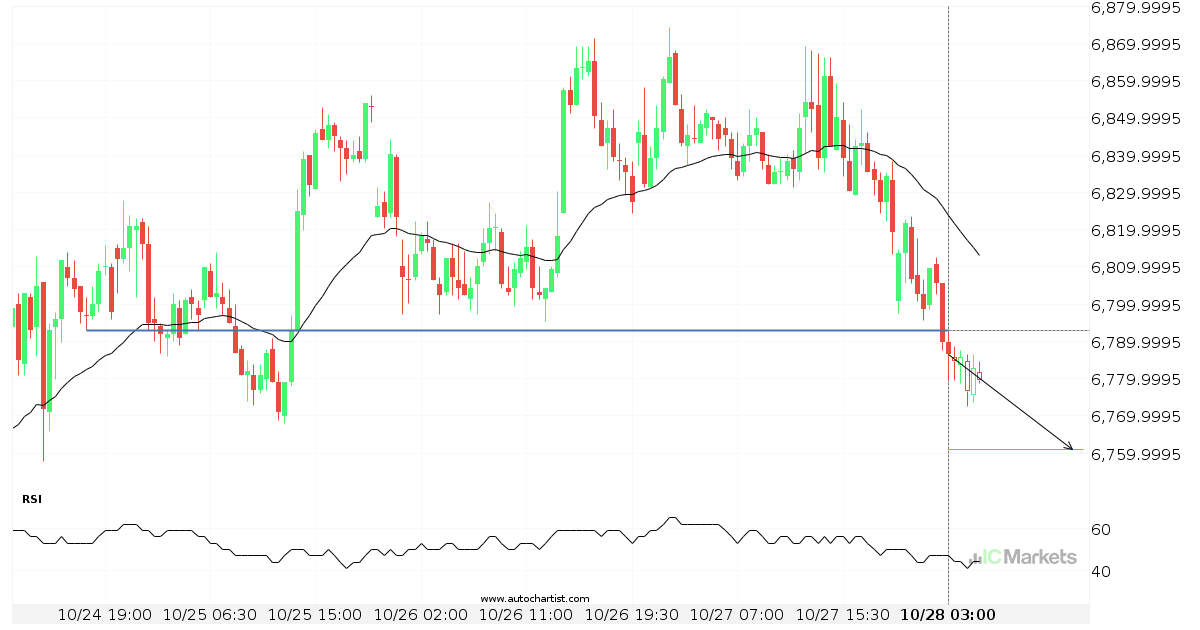
Important price line breached by Australia 200 Index
Australia 200 Index has broken through 6792.7900 which it has tested numerous times in the past. We have seen it retrace from this price in the past. If this new trend persists, Australia 200 Index may be heading towards 6761.0801 within the next 14 hours.
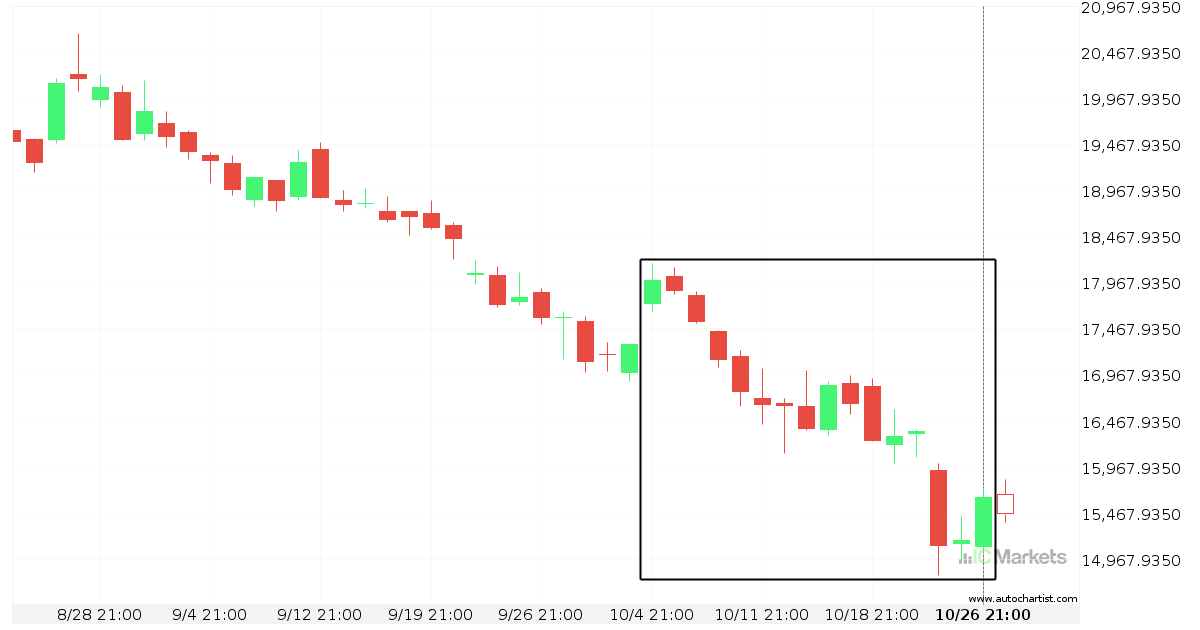
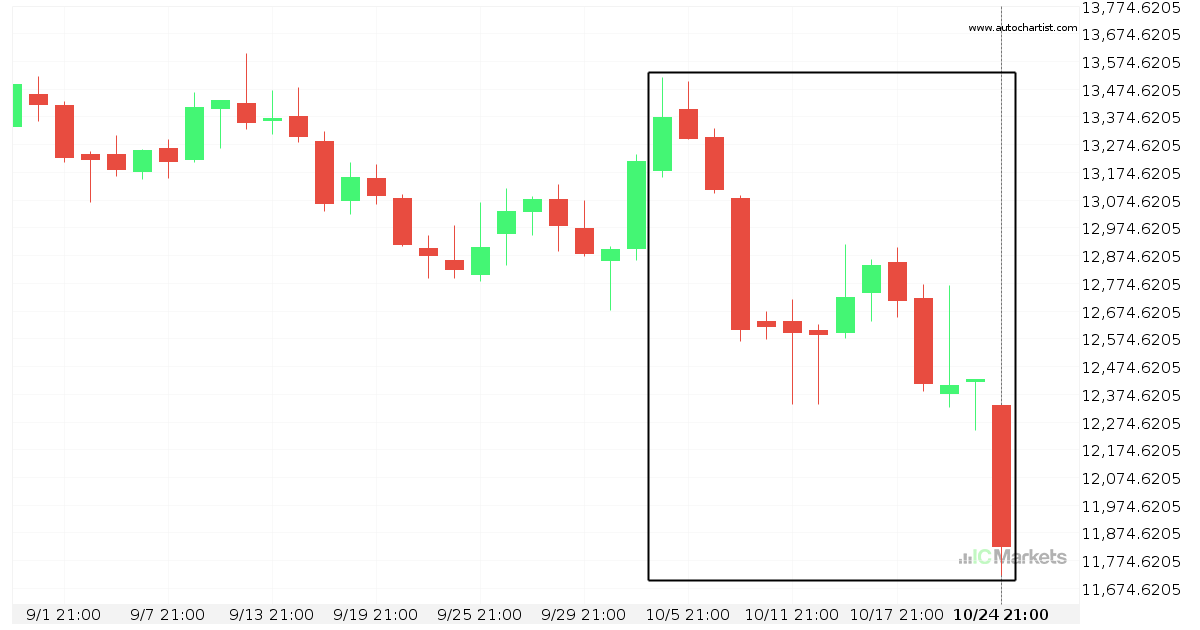
Huge bearish move on Hong Kong 50 Index
Hong Kong 50 Index has moved lower by 13.05% from 17989.1 to 15641.9 in the last 23 days.
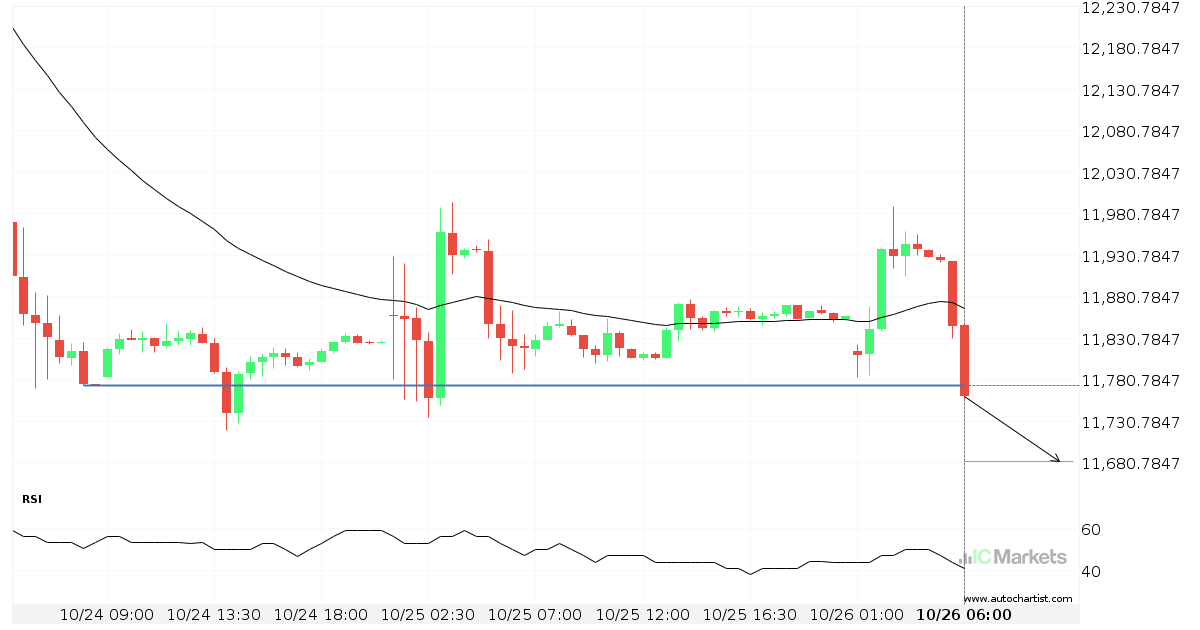
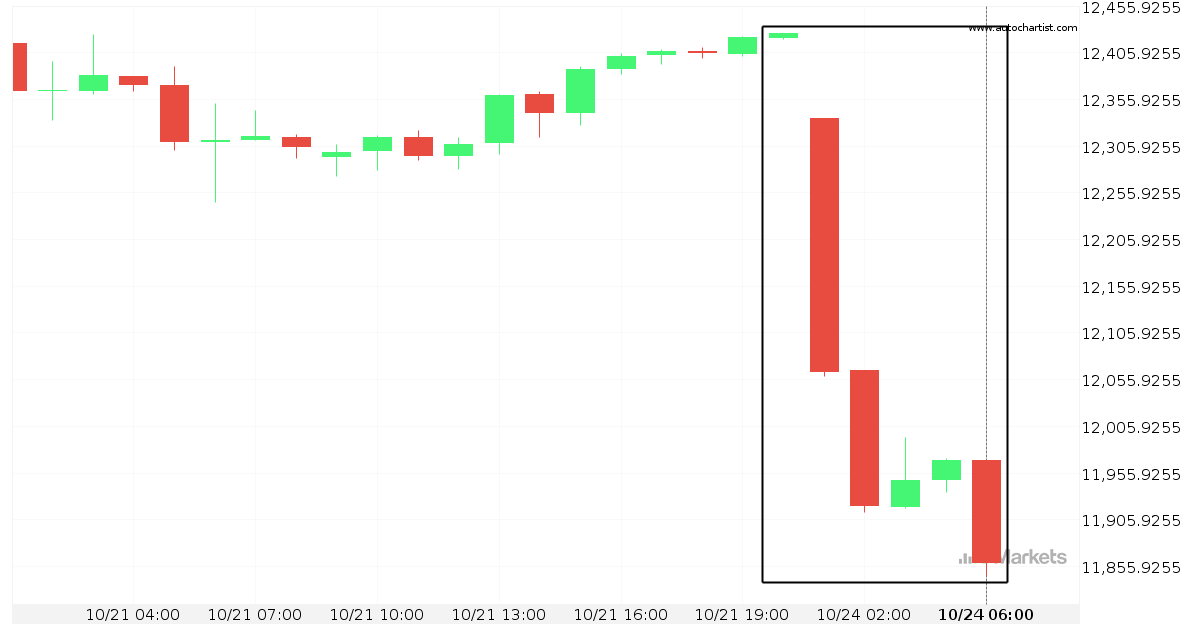
Important price line breached by FTSE China A50 Index
FTSE China A50 Index has broken through 11774.2695 which it has tested numerous times in the past. We have seen it retrace from this price in the past. If this new trend persists, FTSE China A50 Index may be heading towards 11682.4678 within the next 9 hours.
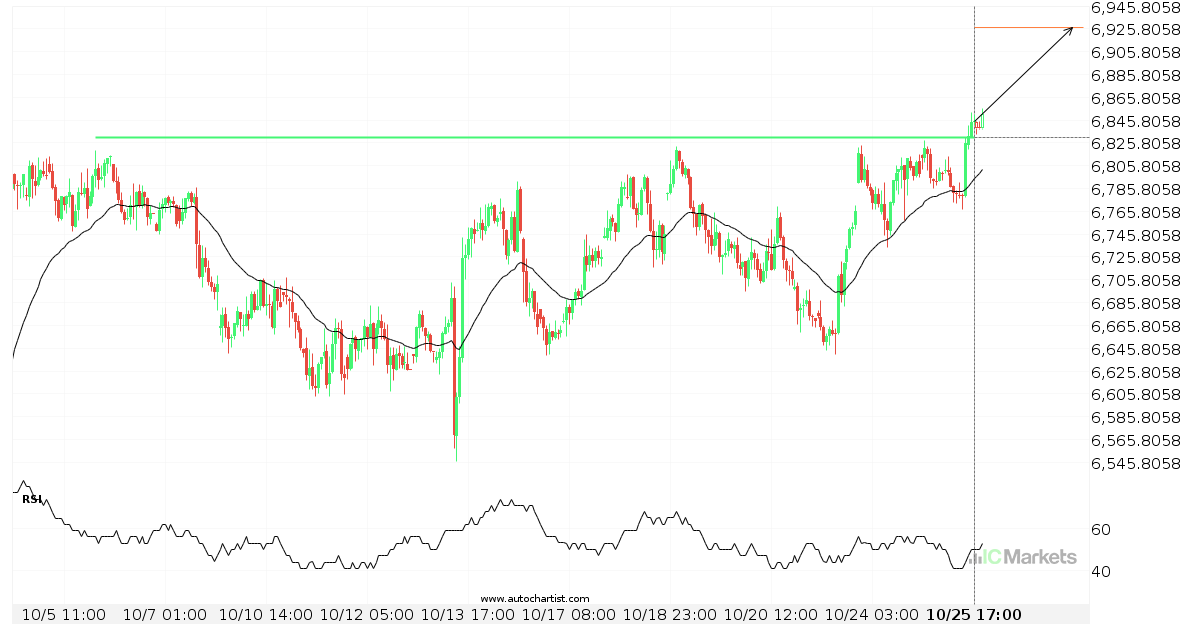
Important price line breached by Australia 200 Index
Australia 200 Index has broken through 6830.8599 which it has tested numerous times in the past. We have seen it retrace from this price in the past. If this new trend persists, Australia 200 Index may be heading towards 6926.8018 within the next 4 days.
What’s going on with FTSE China A50 Index?
Those of you that are trend followers are probably eagerly watching FTSE China A50 Index to see if its latest 11.57% move continues. If not, the mean-reversion people out there will be delighted with this exceptionally large 21 days move.
What’s going on with FTSE China A50 Index?
Those of you that are trend followers are probably eagerly watching FTSE China A50 Index to see if its latest 4.57% move continues. If not, the mean-reversion people out there will be delighted with this exceptionally large 3 days move.
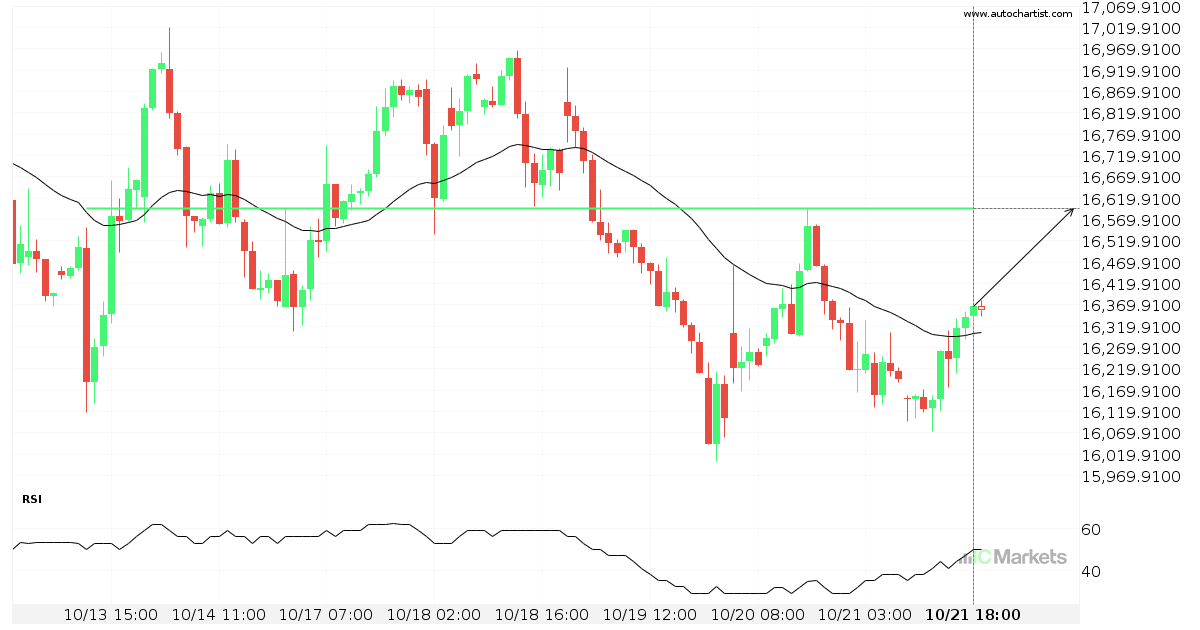
Either a rebound or a breakout imminent on Hong Kong 50 Index
Hong Kong 50 Index is heading towards a line of 16596.5000. If this movement continues, the price of Hong Kong 50 Index could test 16596.5000 within the next 2 days. But don’t be so quick to trade, it has tested this line numerous times in the past, so this movement could be short-lived and end […]
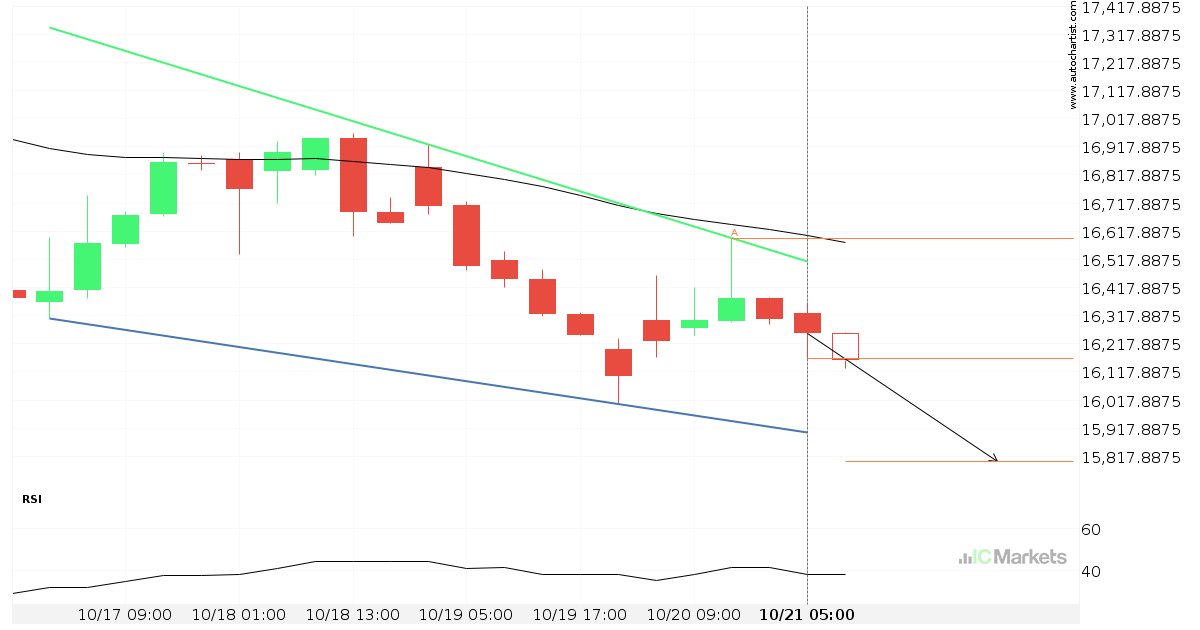
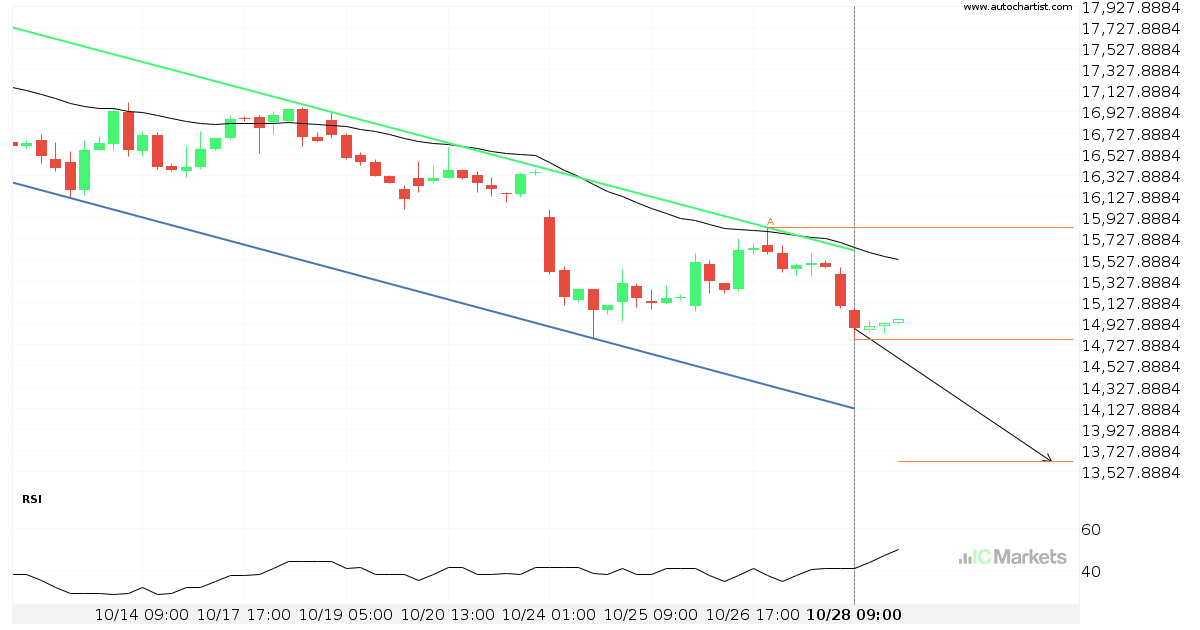
Hong Kong 50 Index approaching support of a Falling Wedge
Hong Kong 50 Index is approaching the support line of a Falling Wedge. It has touched this line numerous times in the last 5 days. If it tests this line again, it should do so in the next 22 hours.
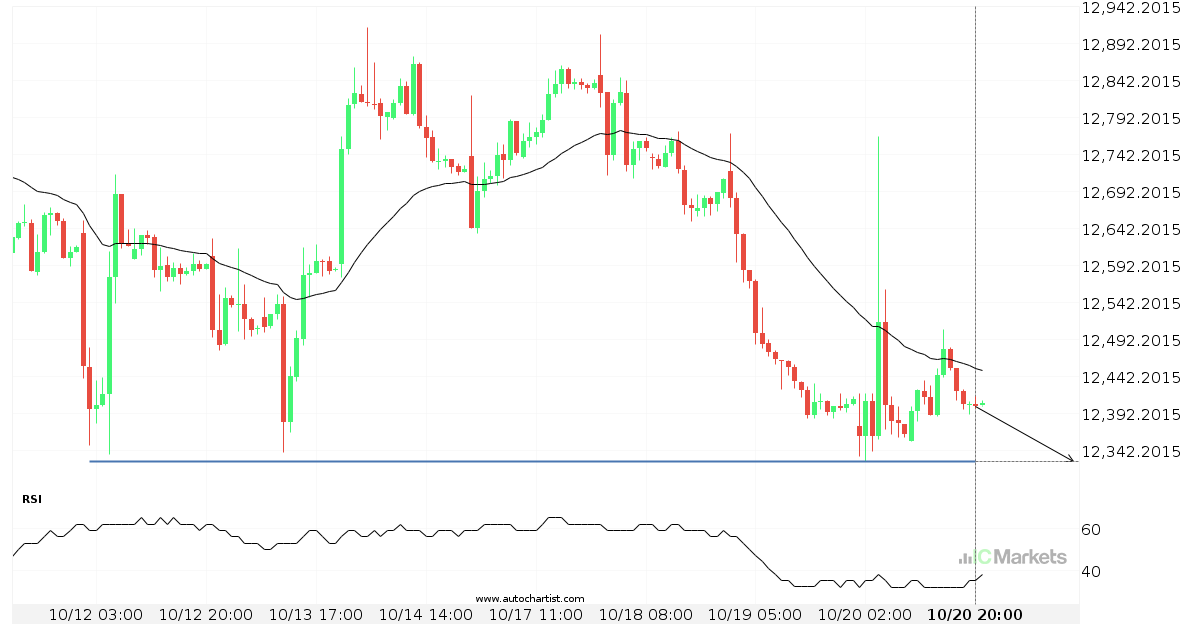
A final push possible on FTSE China A50 Index
FTSE China A50 Index is heading towards 12327.5000 and could reach this point within the next 2 days. It has tested this line numerous times in the past, and this time could be no different, ending in a rebound instead of a breakout. If the breakout doesn’t happen, we could see a retracement back down […]